The HUMAN ENERGY ORGANISATION’S eGap diagnostic analyses individual organisational cultures via our unique framework of 10 organisational behaviours, or ‘dimensions’. The diagnostic asks respondents to show their level of agreement with a series of statements designed to identify the kinds of behaviour that they would hope to experience in the workplace, and to compare this with their real experience of everyday organisational behaviours across the 10 dimensions. The result is a detailed and insightful ‘snapshot’ of the organisation’s culture that highlights areas where this is a significant ‘gap’ between employee aspirations and their experienced reality.
No other diagnostic gives such an accurate analysis of organisational cultures or gives such a clear indication of the aspects of organisational culture that are causing disengagement. By measuring the gap between expectations and experienced reality, eGap is also effectively ‘culture neutral’ – what may be may be experienced as a reassuring level of management support and guidance in one environment may be seen as a lack of autonomy in another; a focus on efficiency may be welcomed as an essential aspect of the job in one organisational culture but be seen as penny-pinching in a different workplace culture – corporate cultures differ widely, and the ‘ideal’ workplace environment differs accordingly.
A new approach to employee engagement
Standard engagement surveys only provide a general measure of levels of employee engagement. Discovering, for example, that your organisation has an ‘engagement profile’ of, say, 71%, suggests that there is an engagement problem, but fails to identify the causes. The problem is compounded when surveys give respondents the option not to agree or disagree with the statements that are meant to be probing levels of engagement. Of the 29% who are not ‘engaged’ in this example, 15% may be described as ‘neutral’. What does that mean?
The questions that are typically used in such surveys can also fail to surface real concerns. An employee may be happy to ‘recommend their employer to a friend or colleague as a place to work’ – but may also have real dissatisfactions with certain aspects of their workplace experience. Organisations are often surprised to find that they have reasonable ‘engagement’ scores, but that a high proportion of respondents also ‘do not see themselves working at the organisation in two years’ time’ – their engagement surveys are failing to surface real underlying concerns.
The eGap diagnostic not only delivers a figure for the ‘Energy Gap’ of the organisation as a whole – which can be compared with, but is different to, the typical ‘engagement profile’ produced by other surveys – but also delivers individual energy gaps for 10 core aspects of organisational behaviour, highlighting areas for concern and pointing the way to effective action. Large gaps can reflect potential employee frustration, unhappiness and disengagement; they reflect the human energy that is wasted when colleagues are not fully engaged.
The table below lists the Human Energy Organisation’s 10 Dimensions of Organisational Behaviour and shows our particular focus for each of these dimensions. Organisations need to feel, for instance, that they are in control, but employees also want a level of autonomy; organisations need measurements to keep track of key performance indicators, but an obsession with the short-term metrics can lose sight of more significant longer-term objectives and make employees feel that their contribution has been reduced to a statistic; organisations need to be efficient, but some quite minor ‘efficiencies’ can impact very negatively on employees…
10 Dimensions of Organisational Behaviour
| Dimension | Employee Perception |
|---|---|
| Control | Personal autonomy vs. organisational control |
| Measurement | The feeling that everything has been reduced to numbers and targets |
| Generosity | The little things that mean a lot |
| Innovation | Feeling free to experiment |
| Communication | Top-down communication vs genuine debate |
| Physical Environment | Too much time at the workstation; not enough interaction with colleagues |
| Self-Organisation | Being allowed to find our own solutions |
| Leadership | Leadership encouraged and enabled at every level of the organisation |
| Networking | The silo effect |
| Diversity of Opinion | Free expression of differing points of view |
Read more about the Human Energy Organisation’s 10 Dimensions of Organisational Behaviour
Asking challenging questions
The eGap survey explores employees’ perception of organisational behaviours by asking them to show their level of agreement with a series of challenging questions. There is no ‘neutral’ option; respondents are forced to take a view by showing that they agree, strongly agree, disagree or strongly disagree with the statements. By way of example, the ‘organisational’ statement for ‘Control’ is, ‘Everything I do at work is monitored and supervised; I don’t feel that the organisation trusts me to do my best.’ Introducing the value statement, ‘I don’t feel the organisation trusts me to do my best’, introduces an emotional element and helps to surface real concerns. Instances where employees show high levels of ‘strong agreement’ with such diagnostic statements are an indication that particular aspects of organisational behaviour are potential sources of employee disengagement. Employees who feel that this statement is not a fair reflection of their experience will ‘disagree’; the absence of a ‘neutral’ option clarifies the issues and prevents fence-sitting.
How the eGap diagnostic works
eGap is based on a simple-to-use online questionnaire consisting of two sets of questions. (The diagnostic can also be delivered in paper form). Diagnostics can be completed in only 10-15 minutes. Results are graphically displayed in reports as radar charts, putting a precise value on ‘the gap’ between expectation and reality across the 10 organisational dimensions (see the Case Study below). The overall ‘Energy Gap’ can also be calculated, giving a measure of the amount of human energy that organisations are losing (or not!) as the result of employee dissatisfaction across all dimensions of organisational behaviour.
Data from the diagnostic can be ‘sliced and diced’ across a number of variables – radar charts can be displayed by age, sex, job status, division, country etc. etc. Repeated diagnostics can be carried out quickly and inexpensively over time to provide actionable feedback on the success of initiatives taken to address the areas of most concern.
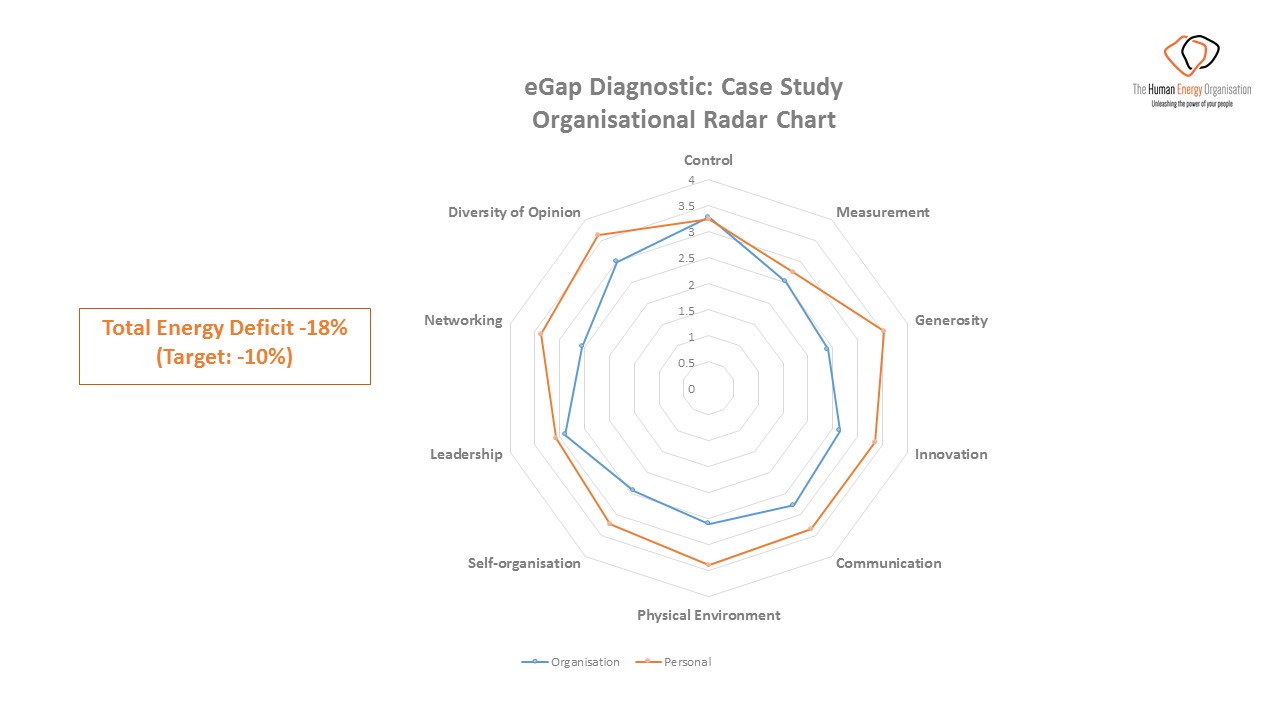
Case Study: professional services company
The chart below is the eGap chart of the UK division of a professional services company. The overall ‘Energy Gap’ for this organisation is -18%: our target energy gap for a company of this kind is -10%.
Low energy deficits
In this example, there are several organisational dimensions where there is no significant gap between employees’ aspirations and their actual experiences of the workplace (see below).
 In this example, there is a zero gap for Control (‘Control vs. autonomy’) and negligible gaps for Leadership (‘Leadership is encouraged at every level of the organisation’) and Measurement (‘Everything is reduced to numbers’). The kind of organisational behaviour that these employees would want to experience on these dimensions is, by and large, what the organisation delivers.
Intermediate energy deficits
The dimensions of Communication (‘Top-down communication vs genuine debate’) and Diversity of Opinion (‘Free expression of differing views’) both show intermediate energy deficits of -17%. Although we are describing these deficits as ‘intermediate’, because they reflect the organisation’s overall Energy Deficit, these scores are not ‘good’.
On the issue of Communication, a significant minority (31%) agree or strongly agree with the statement, ‘We’re always being told what to do but nobody seems to want to listen to what we have to say’, suggesting some experience of a ‘top-down’ communication style that is stifling genuine debate.
 In terms of Diversity of Opinion, there is an indication of concern that the organisation could do more to encourage different opinions to be aired: a small minority of 16% of respondents agree or strongly agree with the statement: ‘There is ‘one right way’ to do things in our organisation: trying different approaches isn’t welcomed.’
High energy deficits
The charts below show the organisational dimensions where there are the highest (‘worst’) energy gaps.
Generosity (‘The little things that mean a lot’): -32%
Self-organisation (‘Being allowed to find our own solutions’): -24%
Networking (‘The silo effect’): -24%
Physical environment (‘Not getting away from the desk to interact with colleagues’): -23%
Innovation (‘Feeling free to experiment’) -22%


There are significant levels of unhappiness about the organisation’s approach to corporate ‘Generosity’: 55% of respondents agree or strongly agree with the statement, ‘When business is difficult, the organisation cuts back on things that it considers to be non-essential, regardless of how this affects people; it’s very demotivating.’

On Self Organisation, 48% of respondents agree or strongly agree with the statement, ‘Nobody in the organisation outside of top management gets consulted about anything, or if we do get consulted, it doesn’t make any difference; we are not very democratic.’

With regards to Networking, 45% of respondents agree or strongly agree with the statement ‘There is no opportunity at work to get to know people who aren’t our immediate colleagues: we’re not encouraged to mix with other departments.’

Case Study conclusions
The Human Energy Organisation’s target Energy Gap for this professional services organisation would be 10%. The highest dimensional energy gaps, in the -20% to -30% range, are worrying, and the organisation’s overall Energy Gap of -18% would be higher still if it were not for the very low gaps on other dimensions, such as Leadership, Control and Measurement. With regards to ‘Measurement’, it is also worth noting that there is respondent ambivalence between the need for measurement and the risk of becoming number-obsessed: 42% of respondents agree or strongly agree with the statement: ‘Management are obsessed by numbers and measurement; we try to deliver the numbers they want, but it’s often a waste of our time.’
Differences by seniority
There were interesting differences shown when results were analysed by respondents’ seniority. More senior staff had a higher overall Energy Deficit of -19%, compared with more junior staff members’ -15%. More senior staff also showed higher deficits than the organisation as a whole for Generosity (‘The little things that mean a lot’) at -36% vs. -32%, and for Networking (‘The silo effect’) at – 28% vs. -24%.
More junior members of staff showed a substantially larger deficit for Physical environment (‘Not getting away from the desk to interact with colleagues’) at -33% vs. -23%.
Case Study: Summary of proposed actions
The significant energy gaps for both Physical Environment (‘Not getting away from the desk to interact with colleagues’) and Networking (The silo effect’) suggest strongly that some relatively simple actions to encourage more internal interaction and discussion could pay dividend. Changes to the layout of the office and the creation of spaces that encourage chance encounters and casual conversation are worth considering, if feasible, as are ‘set-piece’ events, such as regular lunch-time speaker events aimed at bringing people together and stimulating discussion and debate.
The results of this particular organisational diagnostic strongly suggest that recent management action has led to a level of disenchantment regarding organisational Generosity (‘The little things that mean a lot’). The gap between respondents’ aspirations and the perceived reality in terms of organisational generosity was highest for the more senior grades: a -36% gap for grades A7-10 compared with a -21% gap for grades A1-3. This is unusual, in our experience.
The ‘Generosity’ dimension does not explore levels of remuneration but rather ‘the little things that make people feel well looked-after and happy at work’ and ‘demotivating cutbacks’. This adverse perception could be driven as much by ‘not being able to afford the latest pieces of kit’ as by the removal of various perks and indulgences. Very few organisations manage to escape any adverse perceptions in this dimension, but levels shown here are worrying, especially the stronger adverse perception of more senior colleagues.
Although Communication (‘Top down communication vs. genuine dialogue’) showed only an ‘intermediate’ energy deficit, a significant minority (31%) agree or strongly agree with the statement, ‘We’re always being told what to do but nobody seems to want to listen to what we have to say’. There is room for improvement in the quality of communication, which should be seen as part of the same effort as the drive to improve networking, chance encounters and general organisational communication.
The relatively high energy deficit for Innovation (‘Feeling free to experiment’) is of concern for this organisation: a high Energy Gap on this dimension can be a sign that the prevailing culture is over-cautious and that colleagues fear that trying anything new could result in censure.
* * *
FREE EGAP DIAGNOSTIC TRIAL
Companies new to eGap are offered a FREE eGap DIAGNOSTIC TRIAL for around 20 employees. The diagnostic will be delivered online and we will deliver a top-line report with radar charts and analysis (see Case Study examples above), giving a flavour of the kind of insight that a full diagnostic would deliver. Please contact us for more information.
FULL EGAP DIAGNOSTIC from £7,500+vat
Full eGap diagnostics are available from only £7,500 for up to 130 respondents, including up to 3 chosen filters (role, seniority, age, etc.) for comparative analysis. A comprehensive report with radar charts (see Case Study, above) is presented to your chosen team in a half-day workshop by senior members of the Human Energy Organisation team, with a full Q&A session to explore interpretations and potential outcomes.
The offer is designed to deliver a full organisational diagnostic for small- to medium-sized organisations and to offer a meaningful pilot study for larger organisations. The sample size of 130 respondents would provide a 90% Confidence Level with a 5% margin of error for a population of 250 employees on the classic model – though we would argue that the eGap diagnostic explores values and perceptions more than precise intentions, and that smaller sample sizes than those needed for market research or opinion polls can deliver remarkably accurate ‘snapshots’ of an organisation’s state of health.
Full eGap Diagnostic
- Unique eGap diagnostic questionnaire delivered online or on paper
- Explores corporate culture via the Human Energy Organisation’s 10 dimensions of organisational behaviour
- Reveals ‘Energy Gaps’ between employee aspirations and their actual experience of the workplace
- Highlights areas of organisational behaviour that may be causing disengagement
- Results filtered by up to 3 chosen employee parameters (role, seniority, age etc.) for comparative analysis
- Up to 130 respondents analysed (please ask for a quotation for larger numbers)
- Comprehensive written report with radar charts
- Results presented in half-day workshop and Q&A session with senior members of HEO team
Larger respondent numbers and more complex analyses
For individual quotations for eGap diagnostics of over 130 people and/or for additional employee details to be collected and analysed, please do contact us for a free topline quotation, or to arrange a conversation with one of our consultants.
Reporting dashboard for large-scale surveys
Organisations carrying out large-scale surveys using multiple employee parameters can be given their own reporting dashboard, allowing them to interrogate their own data at will.